
If you attended July’s Stormwater Academy meeting, you learned about initial results from the model of the City’s stormwater infrastructure. As part of the year-long effort to update the City’s Stormwater Master Plan, the model allows the planning team to simulate storm events to identify where the capacity of the infrastructure may be deficient.
Since July, the planning team has continued to improve the model based on community feedback and has completed its modeling of the Peavine Creek watershed, for which results were not available prior. Updated model results for Sugar, South Fork Peachtee, and Shoal Creek as well as the new model results for Peavine Creek are now available here.
Decatur Watersheds (.pdf)
Peavine Model Results (.pdf)
Shoal Creek Model Results (.pdf)
South Fork Peachtree Model Results (.pdf)
Sugar Creek Model Results (.pdf)
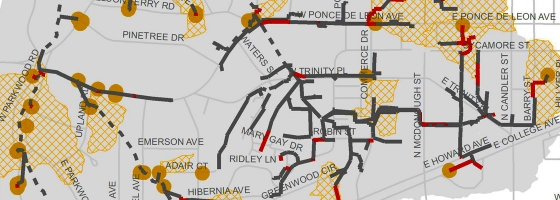
The results estimate the ability of the City’s stormwater infrastructure in each of the city’s four watersheds to manage storm events of two different sizes. The model results are illustrated on maps, which show where simulated storm events result in stormwater flows that approach or exceed the system capacity and may cause surface flooding to occur. The maps also indicate areas of the City where stormwater concerns have been noted in public comments.
A few terms will help you to understand the maps:
Conduits: Underground stormwater infrastructure like pipes or box culverts
Channels: Open waterways including both natural streams and manmade water conveyances that are not enclosed.
Capacity: The proportion of the pipe volume that is used to convey a storm event.
Critical Design Storm: A storm event of duration and intensity that the infrastructure is designed to manage. In the case of Decatur, the critical design storm is 2.2 inches of rain over 6 hours. This amount is reflective of a typical heavy storm.
25-Year Storm: An extreme storm event with a rainfall amount that has a four percent probability of occurring at a location in a year. This event is equal to 5.95 inches over 24 hours and would be an extreme weather event, such as a hurricane.
Flow Deficient Areas: Analysis shows that the roadway drainage inlets may not be sufficient in these areas to adequately drain stormwater from roadway.
The planning team is using these results in making its recommendations for infrastructure improvements. We invite you to send comments and questions about the results, or any final comments on the SWMP update project, to AECOM consultant Katherine Gurd here.
![]()
Enter your address and we’ll email you whenever we post.